> ## Documentation Index
> Fetch the complete documentation index at: https://kalpi.ai/docs/llms.txt
> Use this file to discover all available pages before exploring further.
# Overview & Import
> Get institutional-grade analytics, risk diagnostics, and factor scores for your current holdings.
Kalpi does not just help you build new strategies—it also acts as a powerful diagnostic terminal for the investments you already own. By importing your existing portfolio, you can uncover hidden risks, analyze your exact factor exposures, and benchmark your real-time performance against major indices.
## Importing Your Portfolio
At the top right of the dashboard, you can seamlessly toggle between two different portfolio modes using the dropdown menu:
Securely sync your live portfolio via our read-only API (e.g., Zerodha, Upstox). This ensures your analytics are always automatically up-to-date with your latest live trades.
Create isolated virtual portfolios to manually track outside assets, test hypothetical allocations, or upload historical data before committing real capital.
***
## Setting Up a Virtual Portfolio
If you choose not to connect a live broker, setting up a Virtual Portfolio allows you to analyze any basket of stocks instantly.
Select **Virtual Portfolio** from the top right dropdown menu, then click the **Update** button next to it. Select **Add a New Virtual Portfolio** and give your custom basket a name.
You have two distinct ways to populate your virtual portfolio:
* **CSV Upload:** Have your holdings in a spreadsheet? You can instantly upload multiple investments at once using our pre-defined CSV file format.
* **Virtual Entry:** Want to build it manually? Select this to directly search for Stock Symbols one by one and input your exact Quantity and Average Price.
Once your stocks are entered or uploaded, click the green **Analyze Portfolio** button. Kalpi will instantly generate an institutional-grade dashboard based on those exact holdings.
***
## Portfolio Health & SWOT Analysis
Once your portfolio is loaded (either live or virtual), Kalpi runs an immediate diagnostic check to evaluate the overall health of your investments.
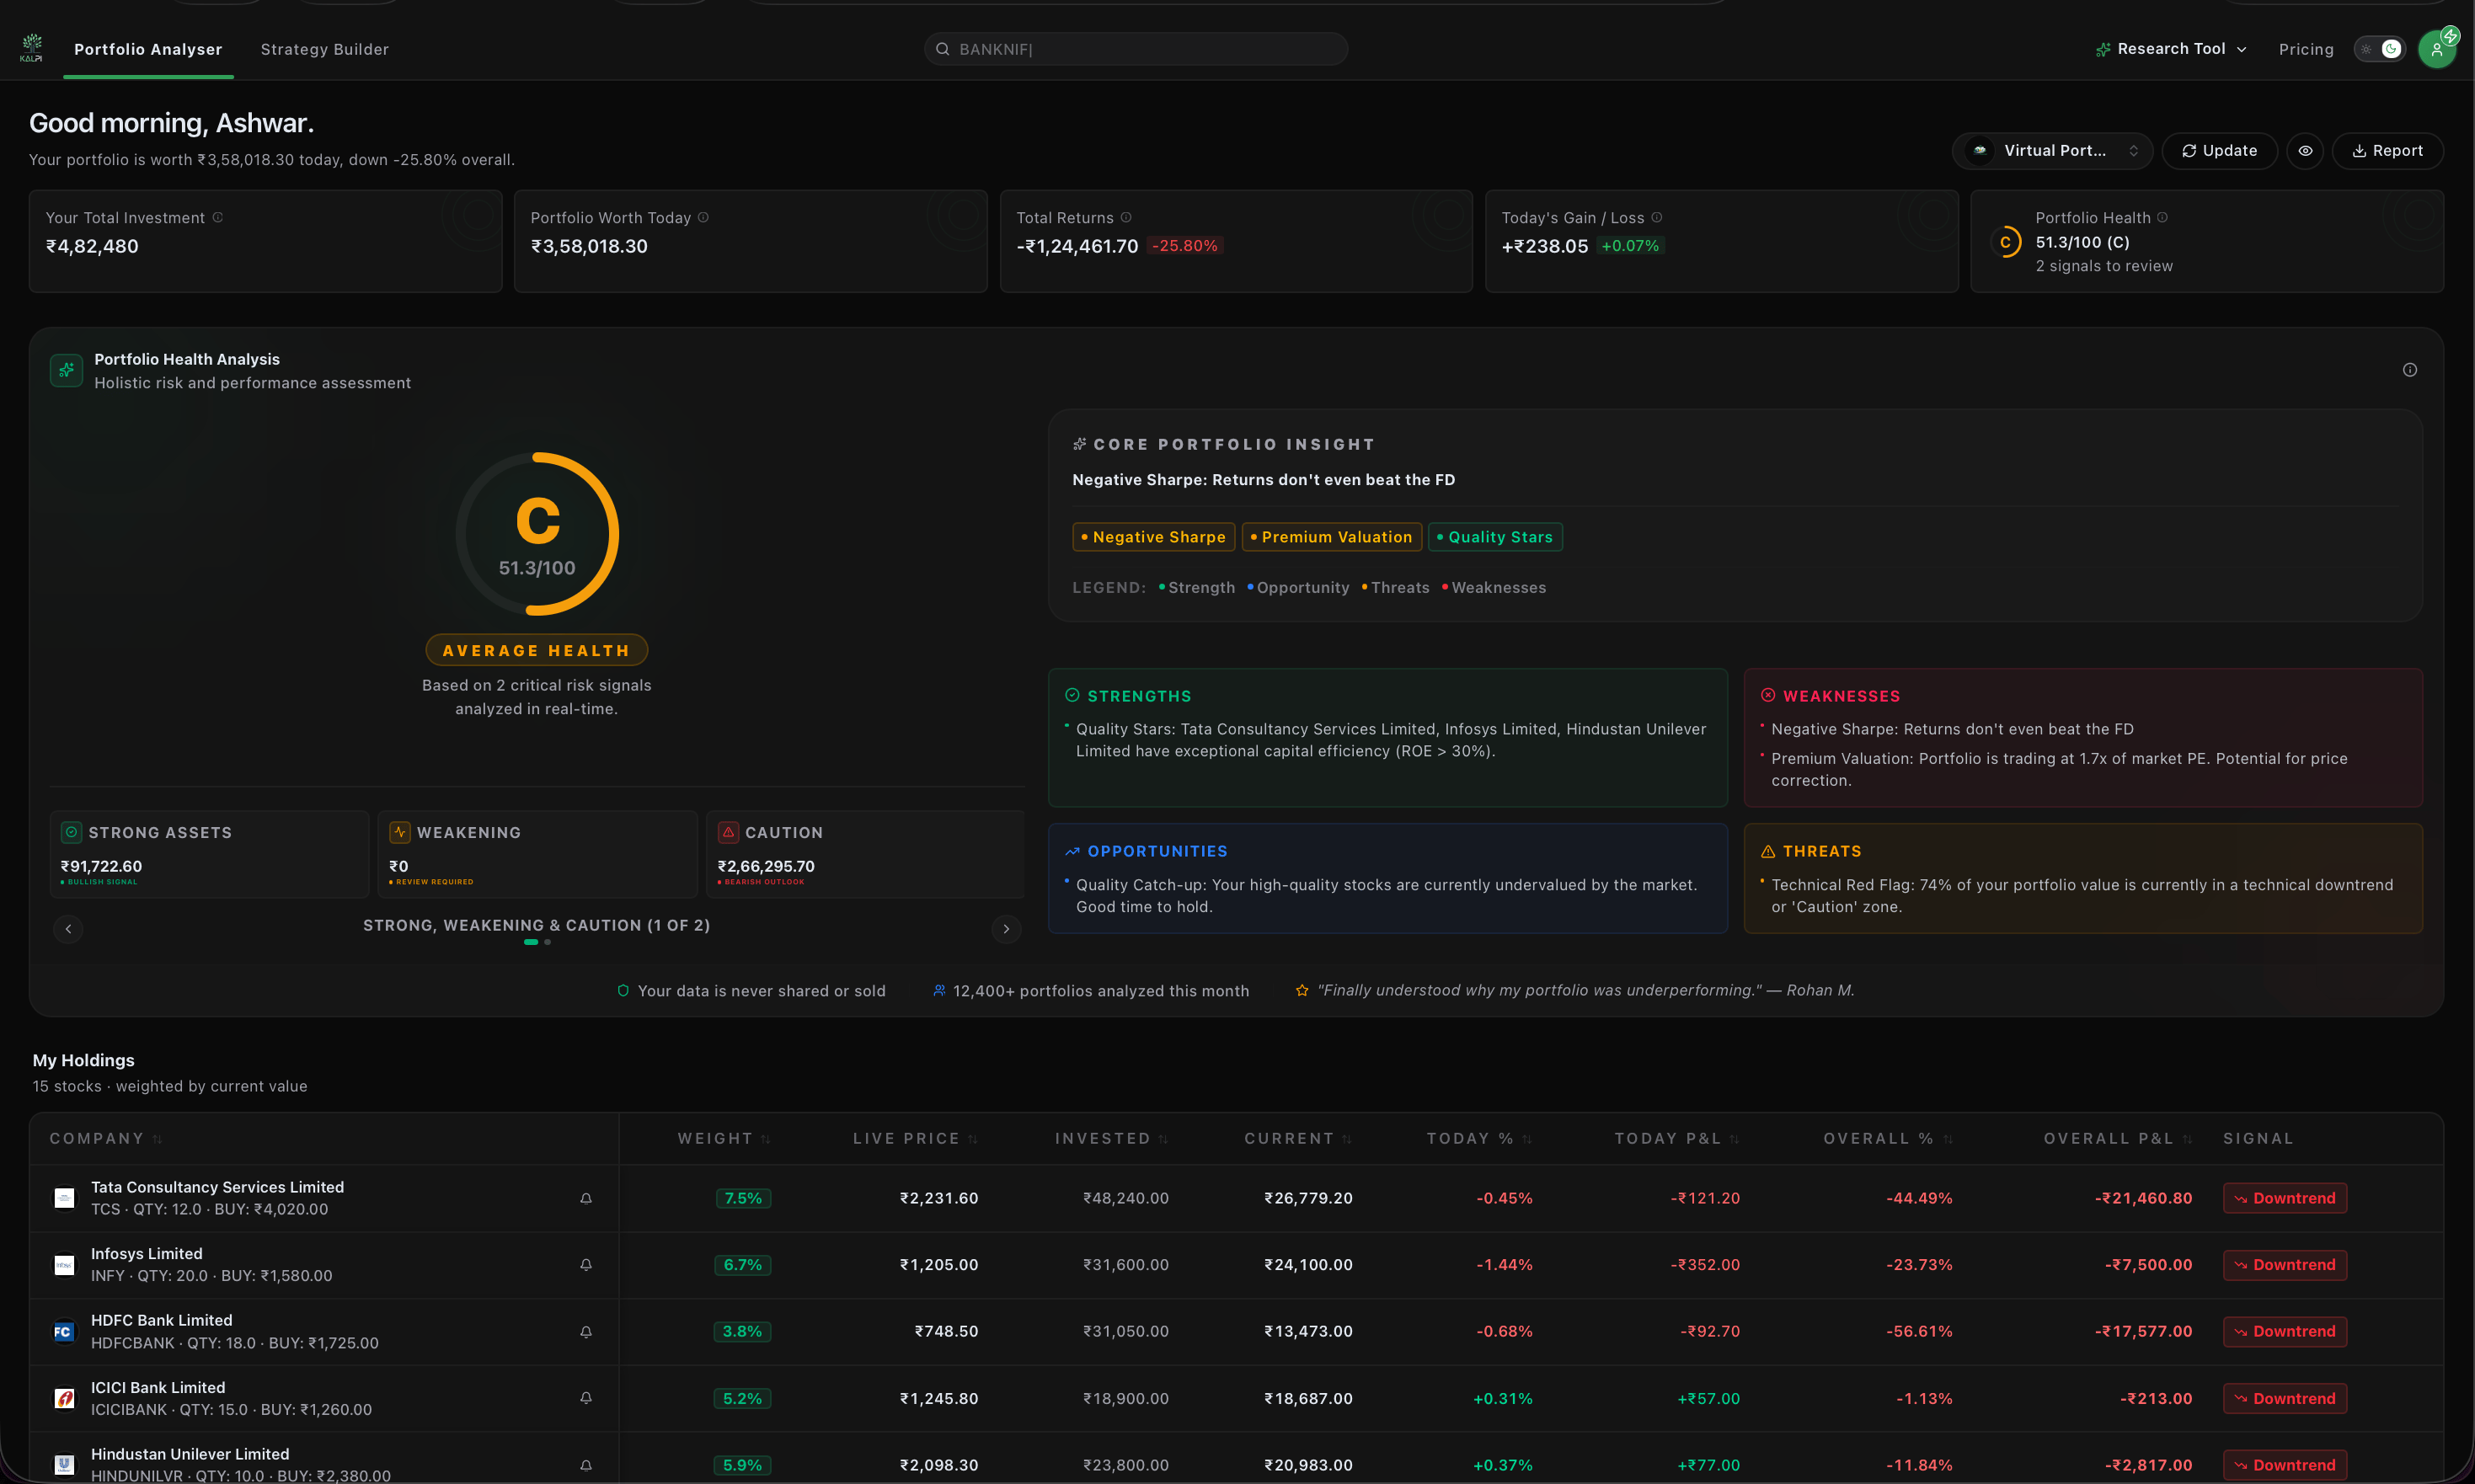 * **Health Score:** Your portfolio is graded on a scale of A to F based on critical risk signals, asset quality, and historical performance.
* **Core Portfolio Insights (SWOT):** Our engine generates a personalized, text-based diagnostic report highlighting your portfolio's **Strengths** (e.g., high-quality compounders), **Weaknesses** (e.g., negative ROE stocks), **Opportunities** (e.g., diversification gaps), and **Threats** (e.g., over-concentration in specific sectors).
***
## Deep-Dive Analytics
Scrolling past the initial health check unlocks a suite of quantitative tools typically reserved for institutional hedge funds.
* **Health Score:** Your portfolio is graded on a scale of A to F based on critical risk signals, asset quality, and historical performance.
* **Core Portfolio Insights (SWOT):** Our engine generates a personalized, text-based diagnostic report highlighting your portfolio's **Strengths** (e.g., high-quality compounders), **Weaknesses** (e.g., negative ROE stocks), **Opportunities** (e.g., diversification gaps), and **Threats** (e.g., over-concentration in specific sectors).
***
## Deep-Dive Analytics
Scrolling past the initial health check unlocks a suite of quantitative tools typically reserved for institutional hedge funds.
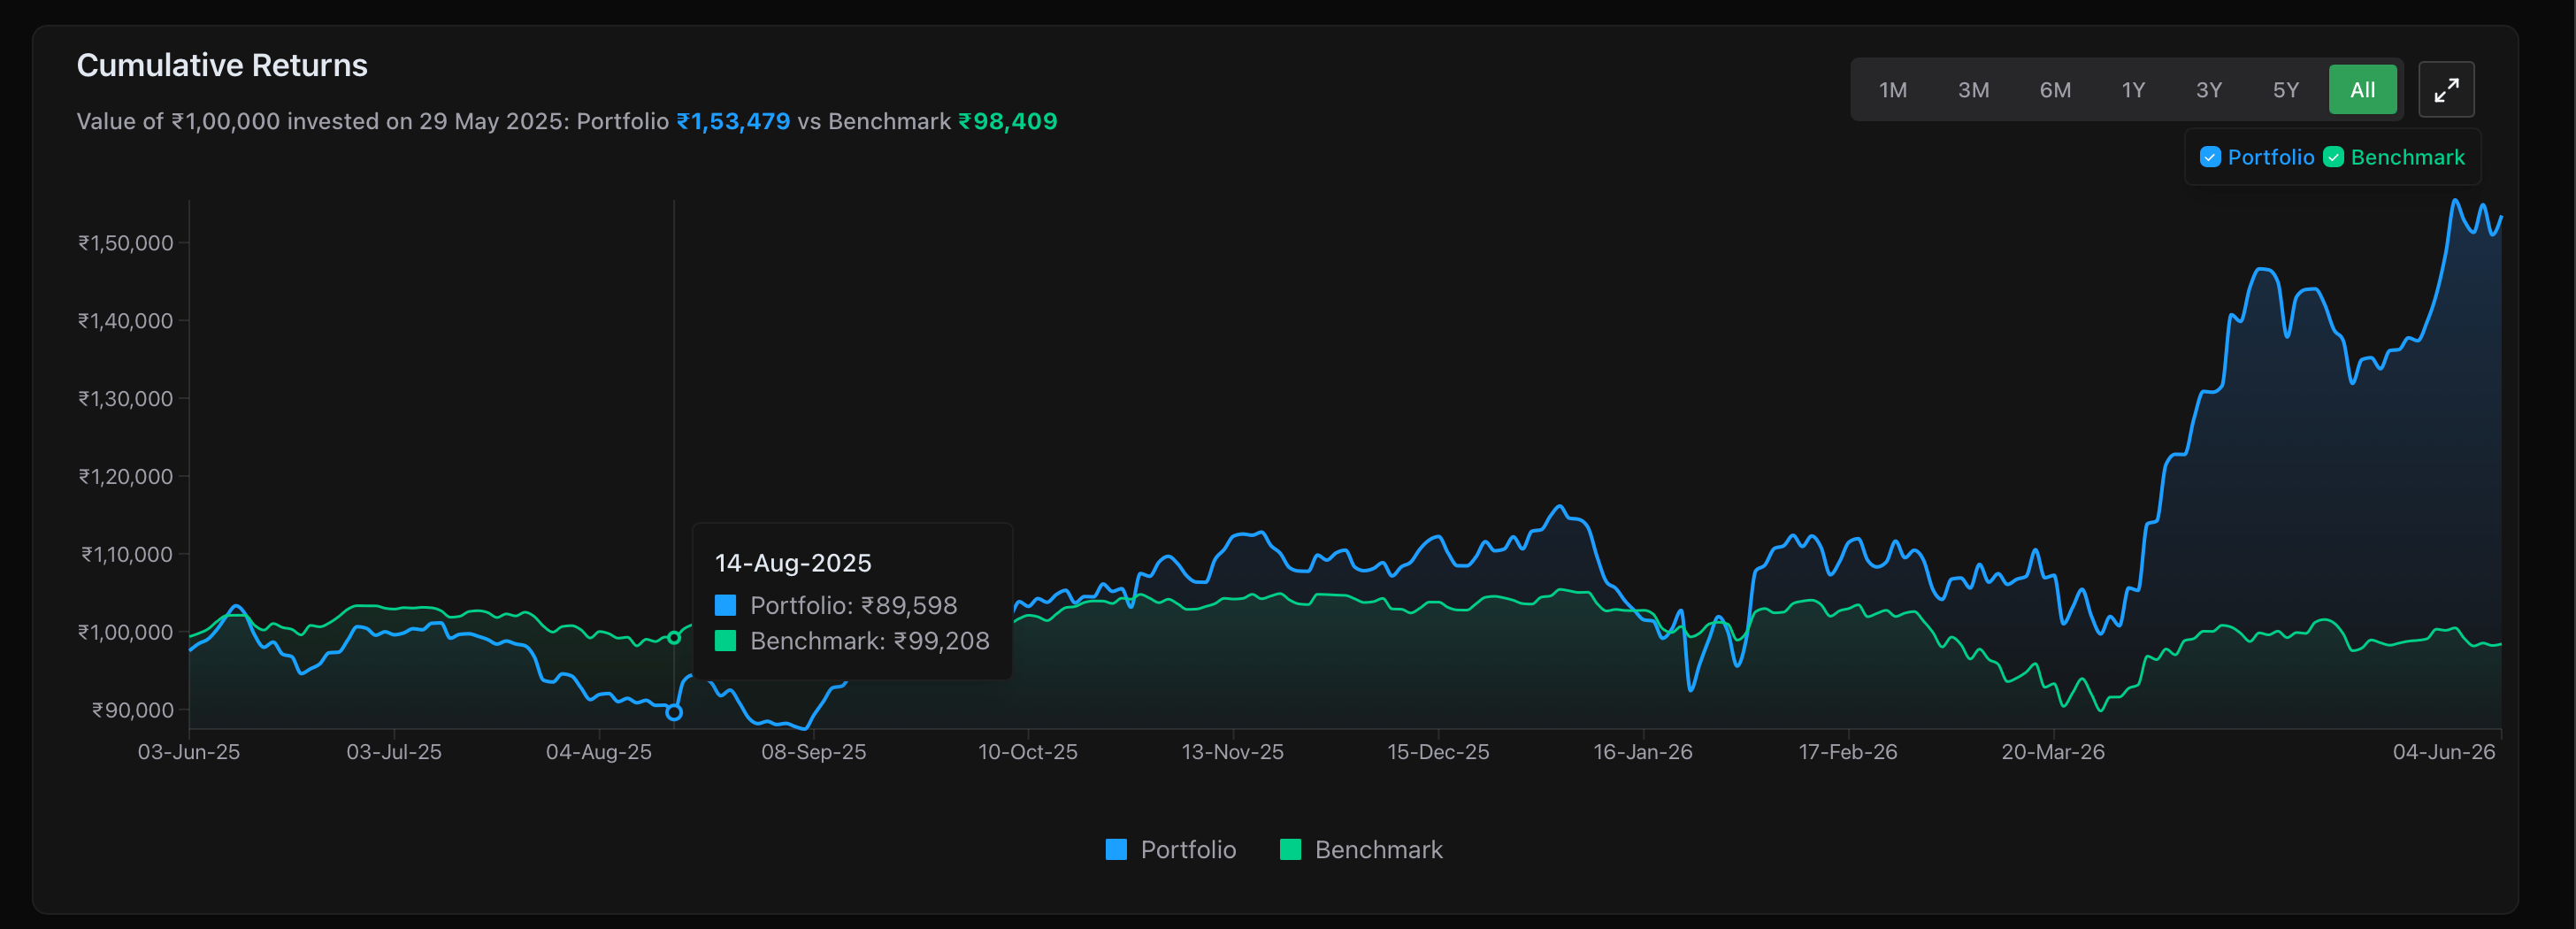 Compare your cumulative returns directly against a benchmark index (like the Nifty 50). Kalpi automatically calculates advanced risk-adjusted metrics for your entire portfolio, including **Volatility**, **Sharpe Ratio**, and **Sortino Ratio**, letting you know if your returns are truly beating the market on a risk-adjusted basis.
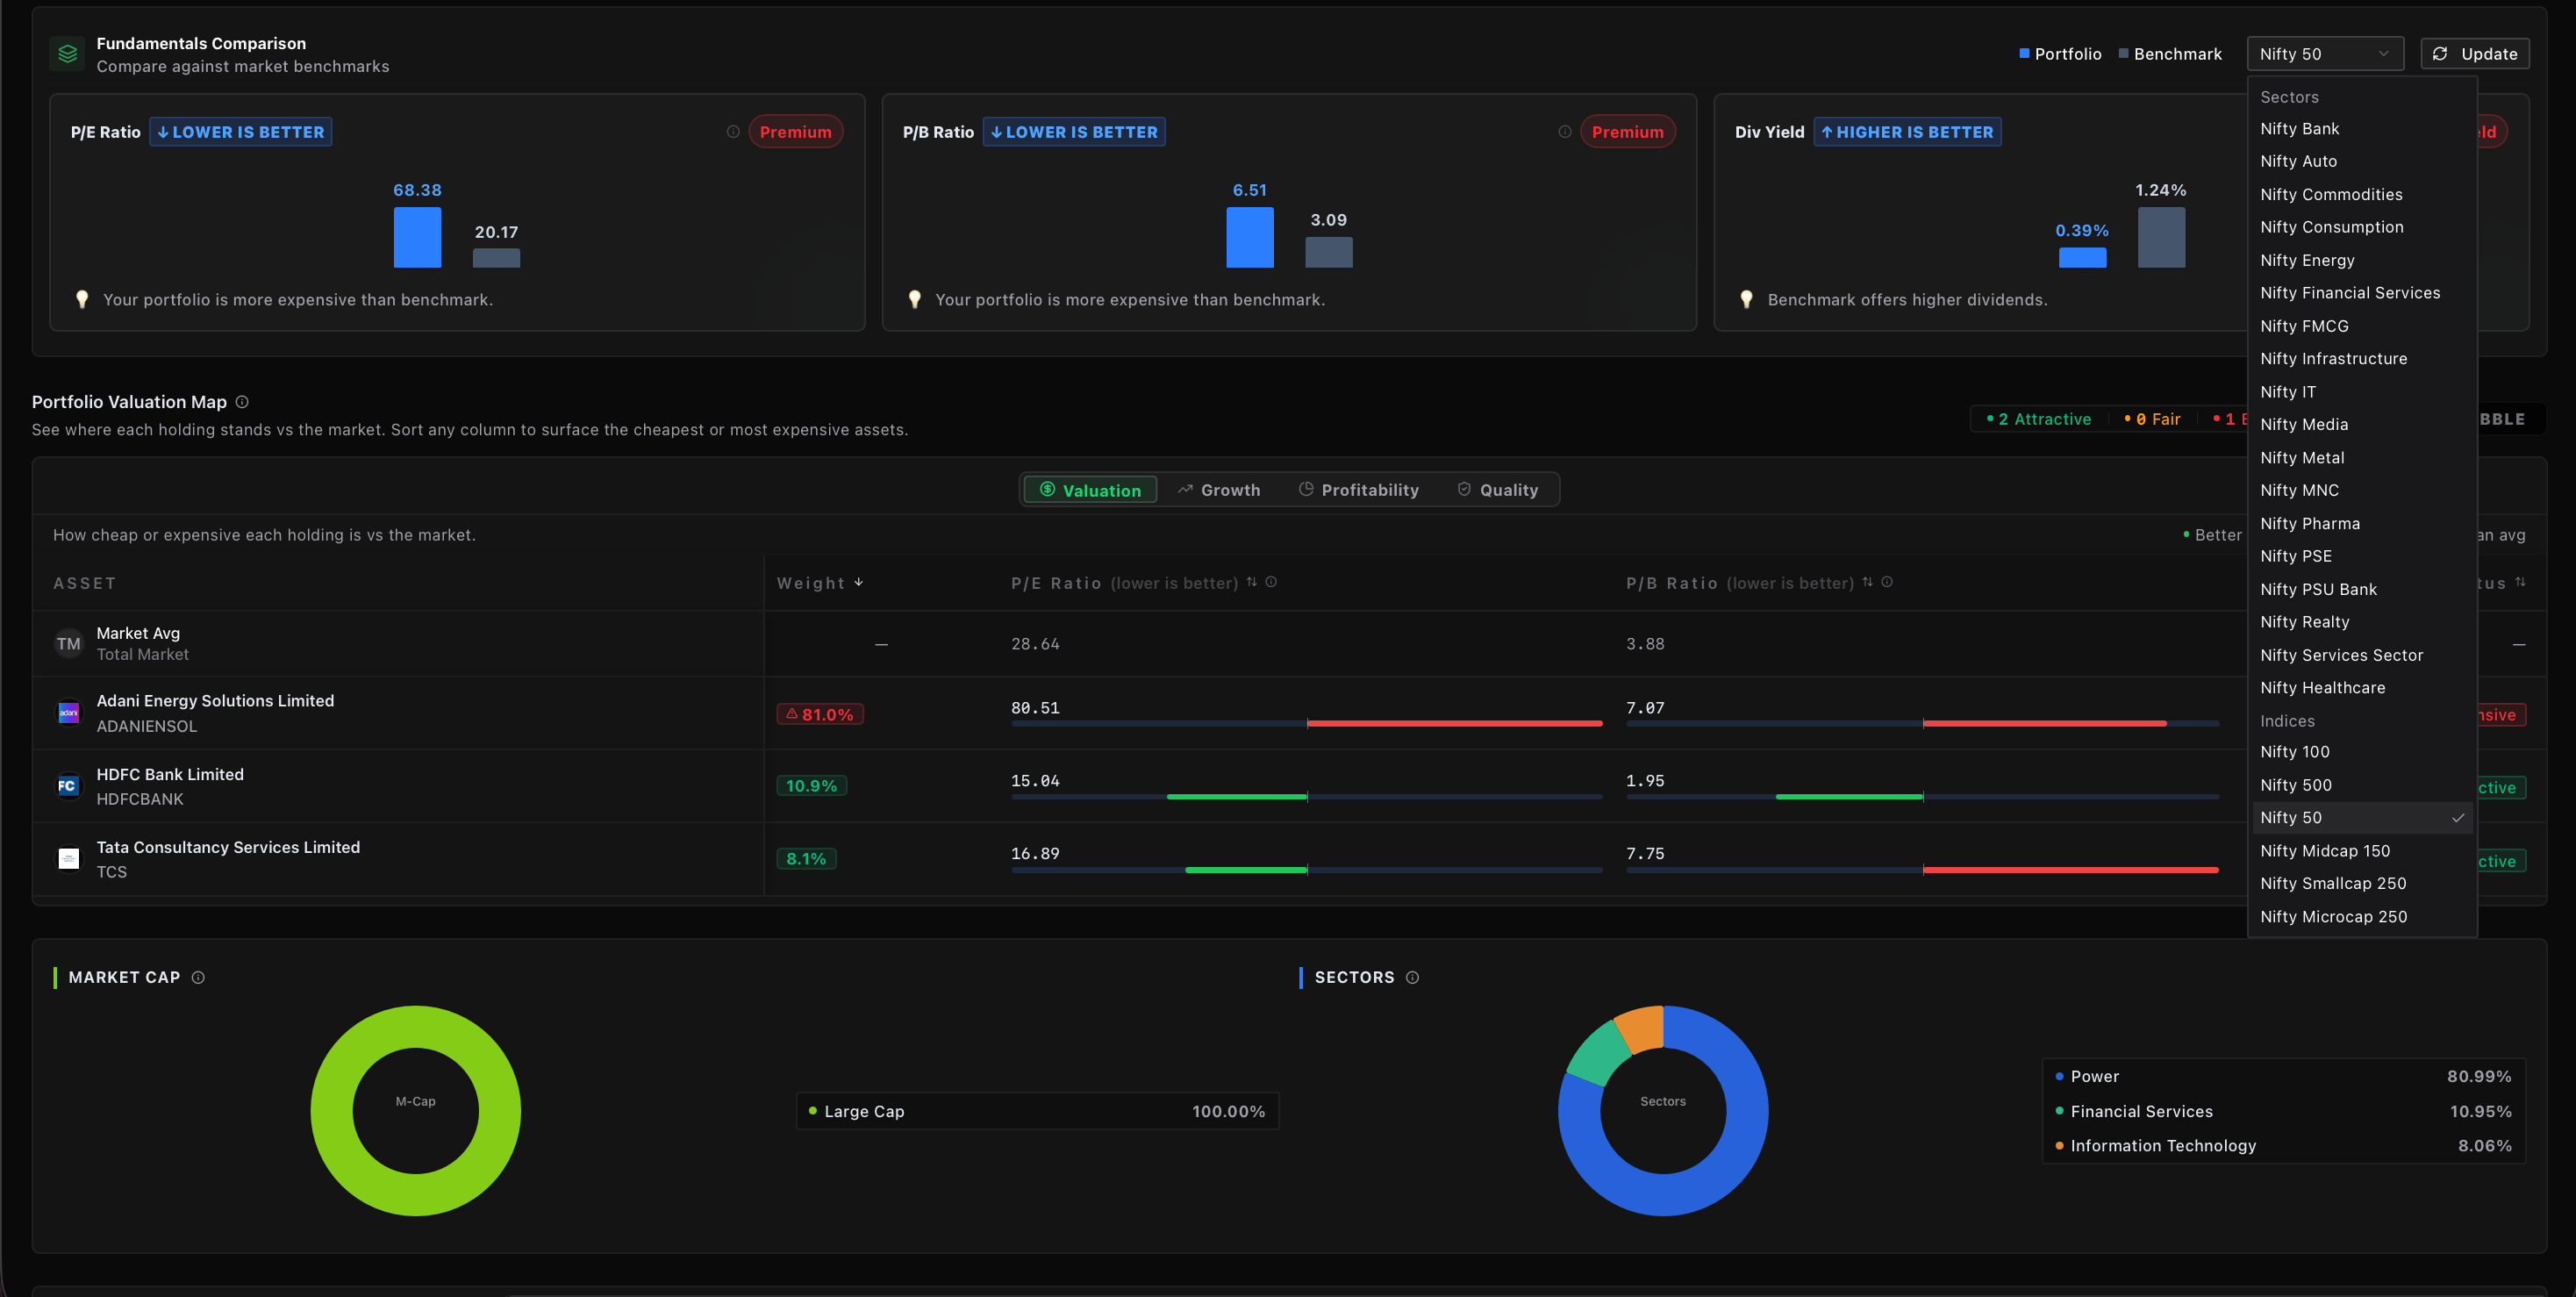
Are you overpaying for your current assets? View aggregate **P/E Ratios**, **P/B Ratios**, and **Dividend Yields** compared strictly against the benchmark. The **Portfolio Valuation Map** and interactive pie charts also give you a bird's-eye view of your Market Cap and Sector allocations.
Compare your cumulative returns directly against a benchmark index (like the Nifty 50). Kalpi automatically calculates advanced risk-adjusted metrics for your entire portfolio, including **Volatility**, **Sharpe Ratio**, and **Sortino Ratio**, letting you know if your returns are truly beating the market on a risk-adjusted basis.
Are you overpaying for your current assets? View aggregate **P/E Ratios**, **P/B Ratios**, and **Dividend Yields** compared strictly against the benchmark. The **Portfolio Valuation Map** and interactive pie charts also give you a bird's-eye view of your Market Cap and Sector allocations.
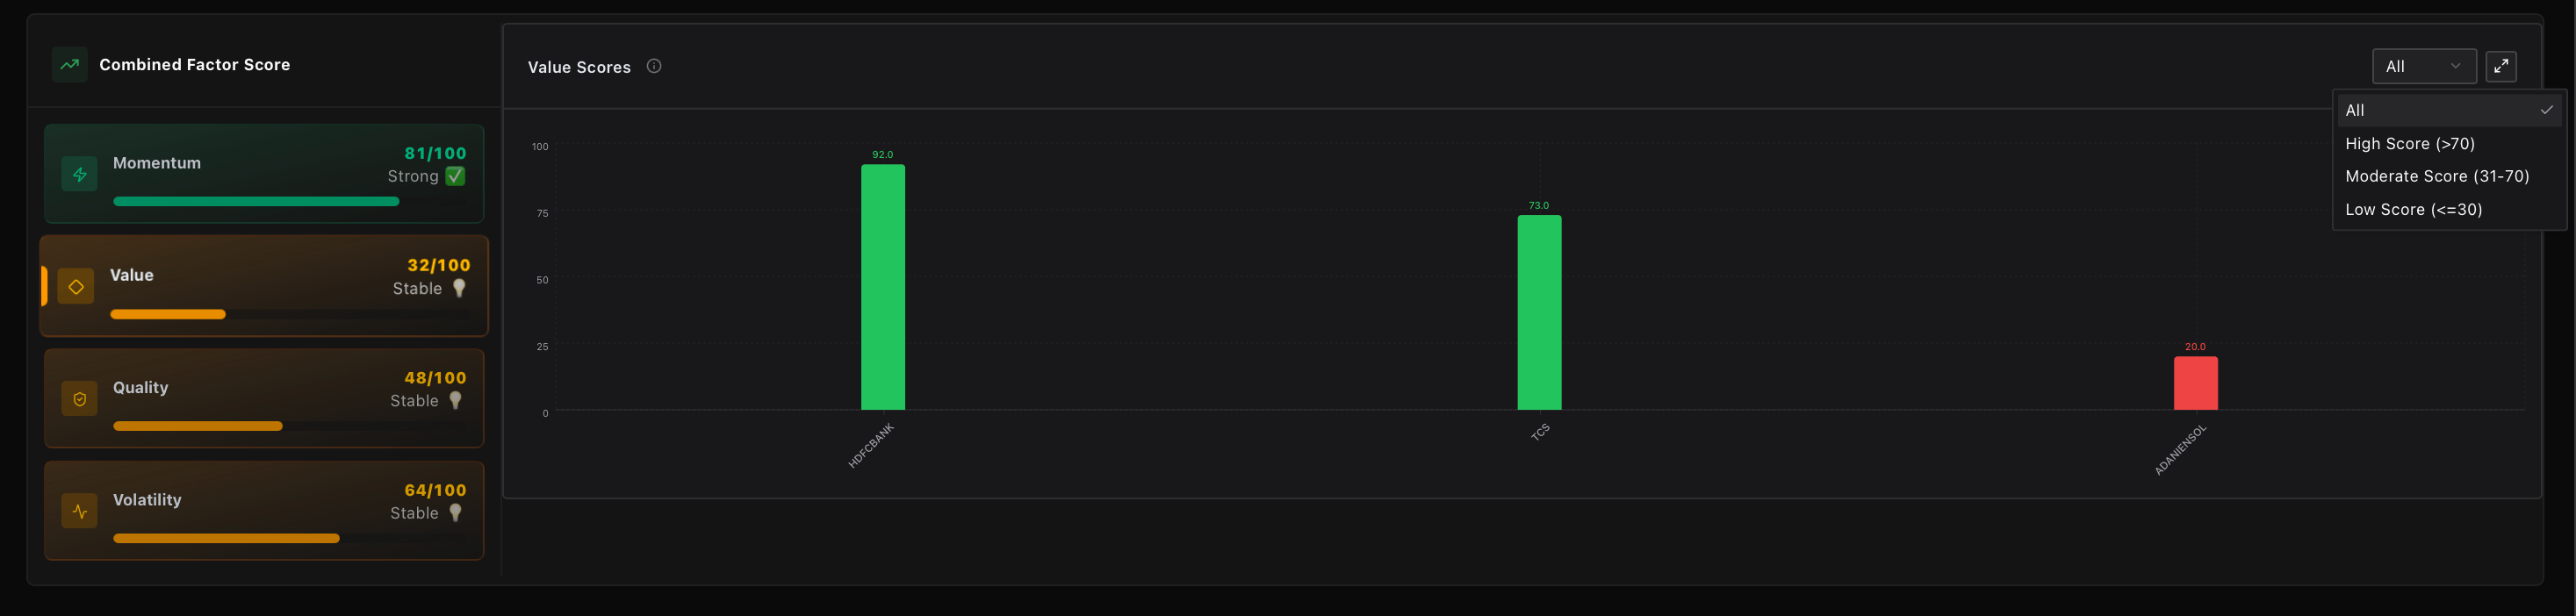 Uncover the hidden drivers of your returns. Kalpi assigns a score (0-100) to your portfolio across four major quantitative factors: **Momentum**, **Value**, **Quality**, and **Volatility**. You can view a bar chart of exactly how every individual stock in your portfolio scores within these specific factors.
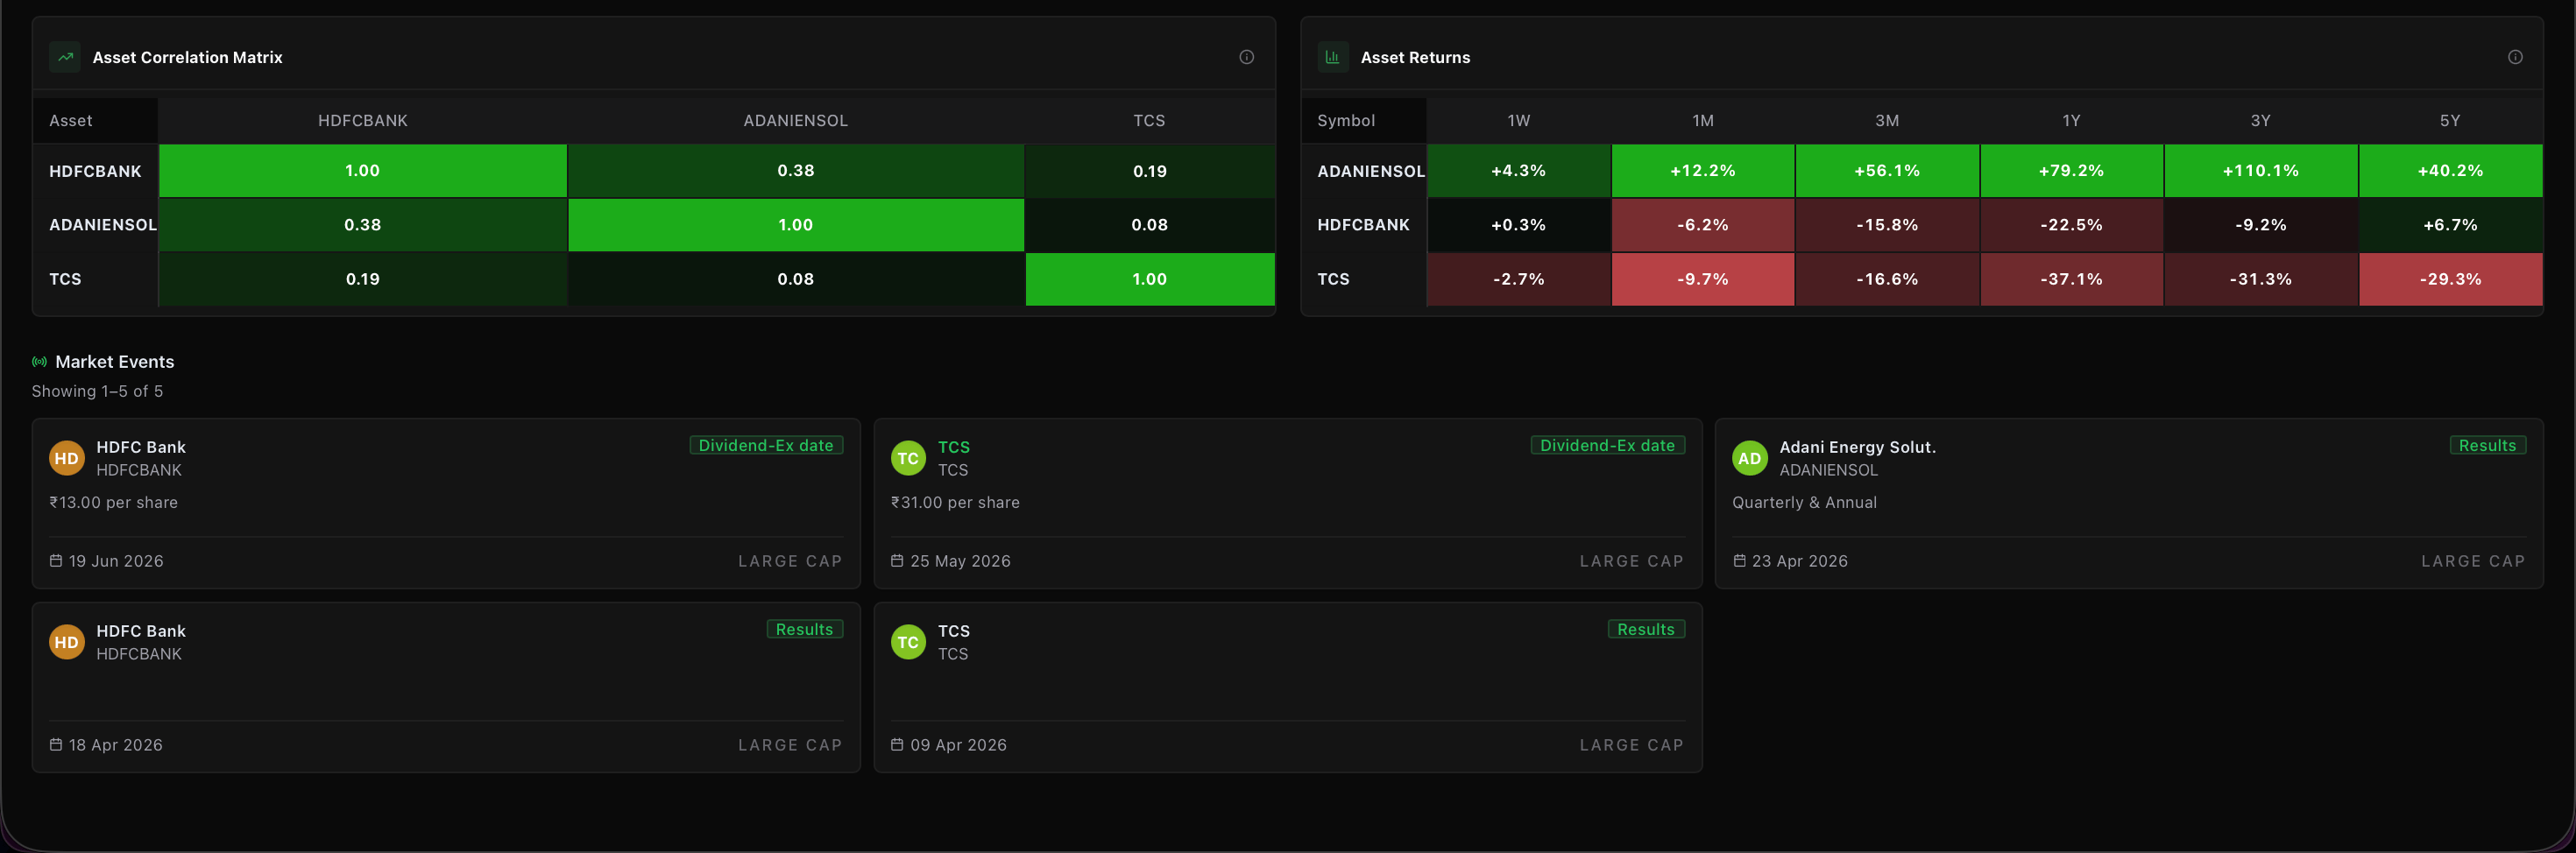
A truly diversified portfolio needs assets that do not move identically. Kalpi provides a live **Asset Correlation Matrix** (heatmap) to warn you if your stocks are highly correlated (greater than 85%), which could drag down your portfolio's defensive capabilities during a market crash.
Uncover the hidden drivers of your returns. Kalpi assigns a score (0-100) to your portfolio across four major quantitative factors: **Momentum**, **Value**, **Quality**, and **Volatility**. You can view a bar chart of exactly how every individual stock in your portfolio scores within these specific factors.
A truly diversified portfolio needs assets that do not move identically. Kalpi provides a live **Asset Correlation Matrix** (heatmap) to warn you if your stocks are highly correlated (greater than 85%), which could drag down your portfolio's defensive capabilities during a market crash.
 **Export Your Data:** Need to share these insights or save a snapshot of your portfolio's health? Click the **Report** button in the top right corner of the dashboard to instantly download a comprehensive PDF report of your analytics.