> ## Documentation Index
> Fetch the complete documentation index at: https://kalpi.ai/docs/llms.txt
> Use this file to discover all available pages before exploring further.
# Live Strategies
> Monitor real-time performance, track active holdings, and export data for your deployed portfolios.
The **Live Strategies** tab is the final destination in the Basket Builder workflow. Once you click "Invest Now" and deploy a strategy, it moves here so you can track its real-time performance and monitor your live capital allocation.
 ## The Dashboard Overview
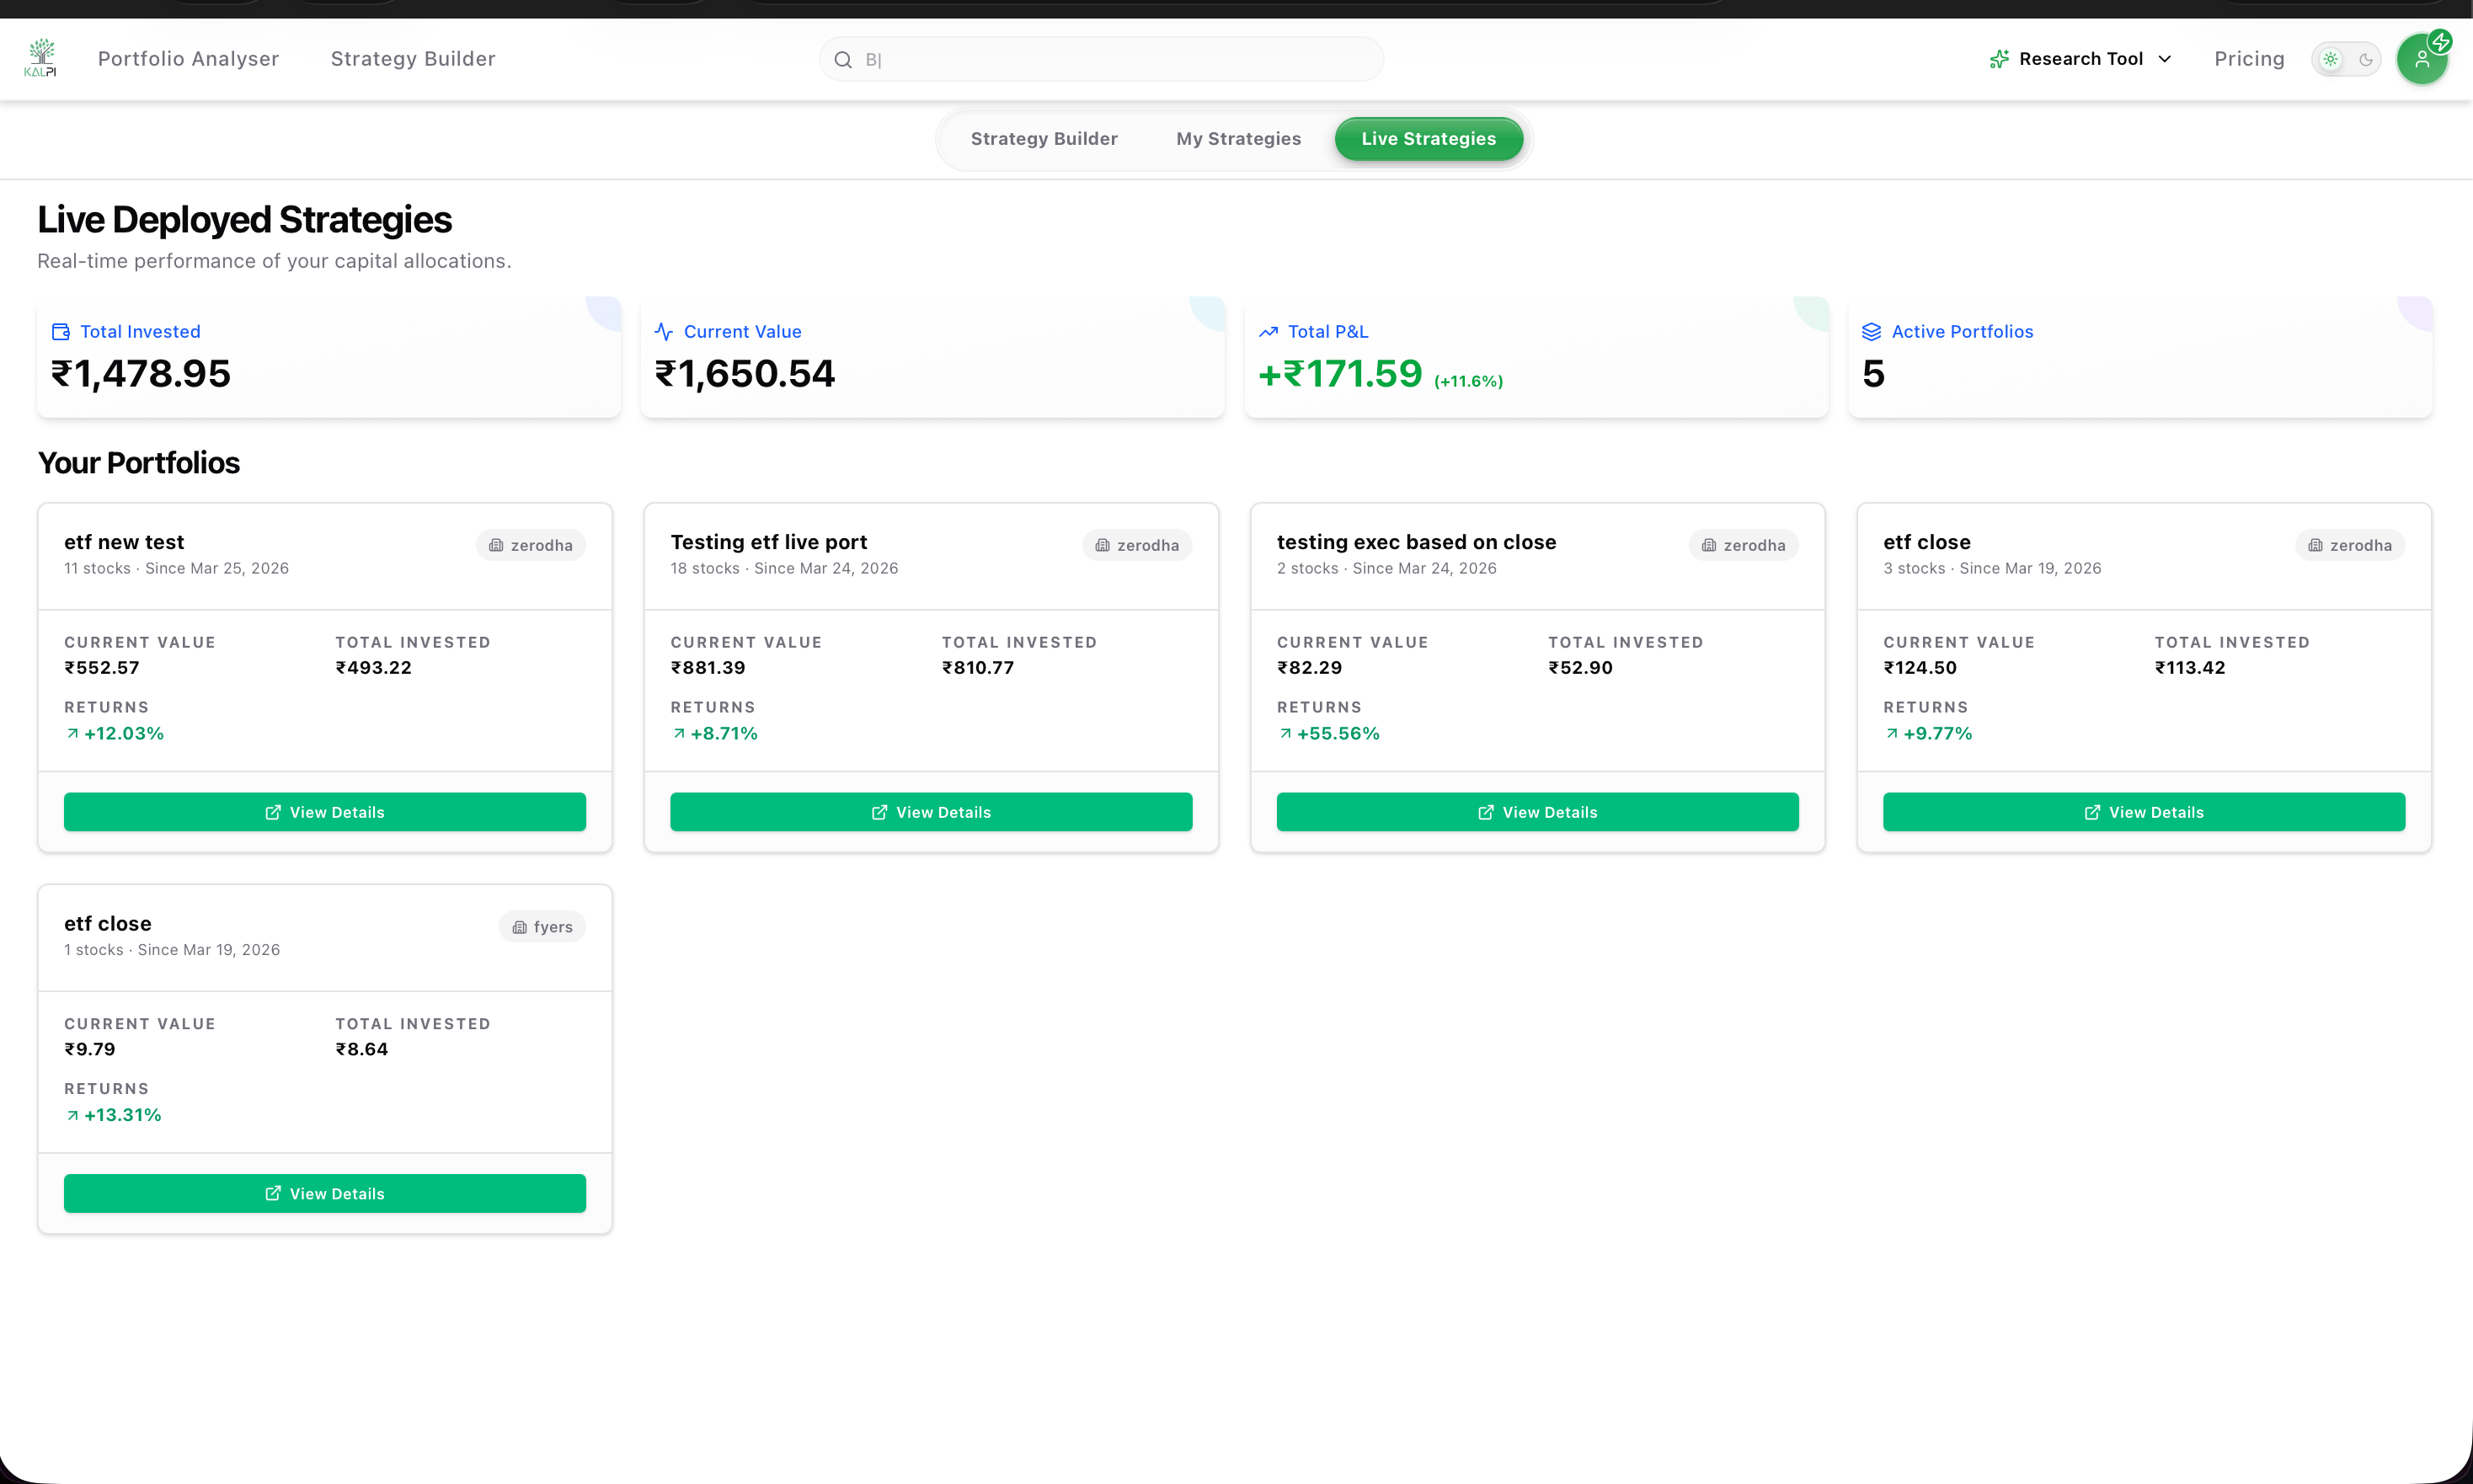
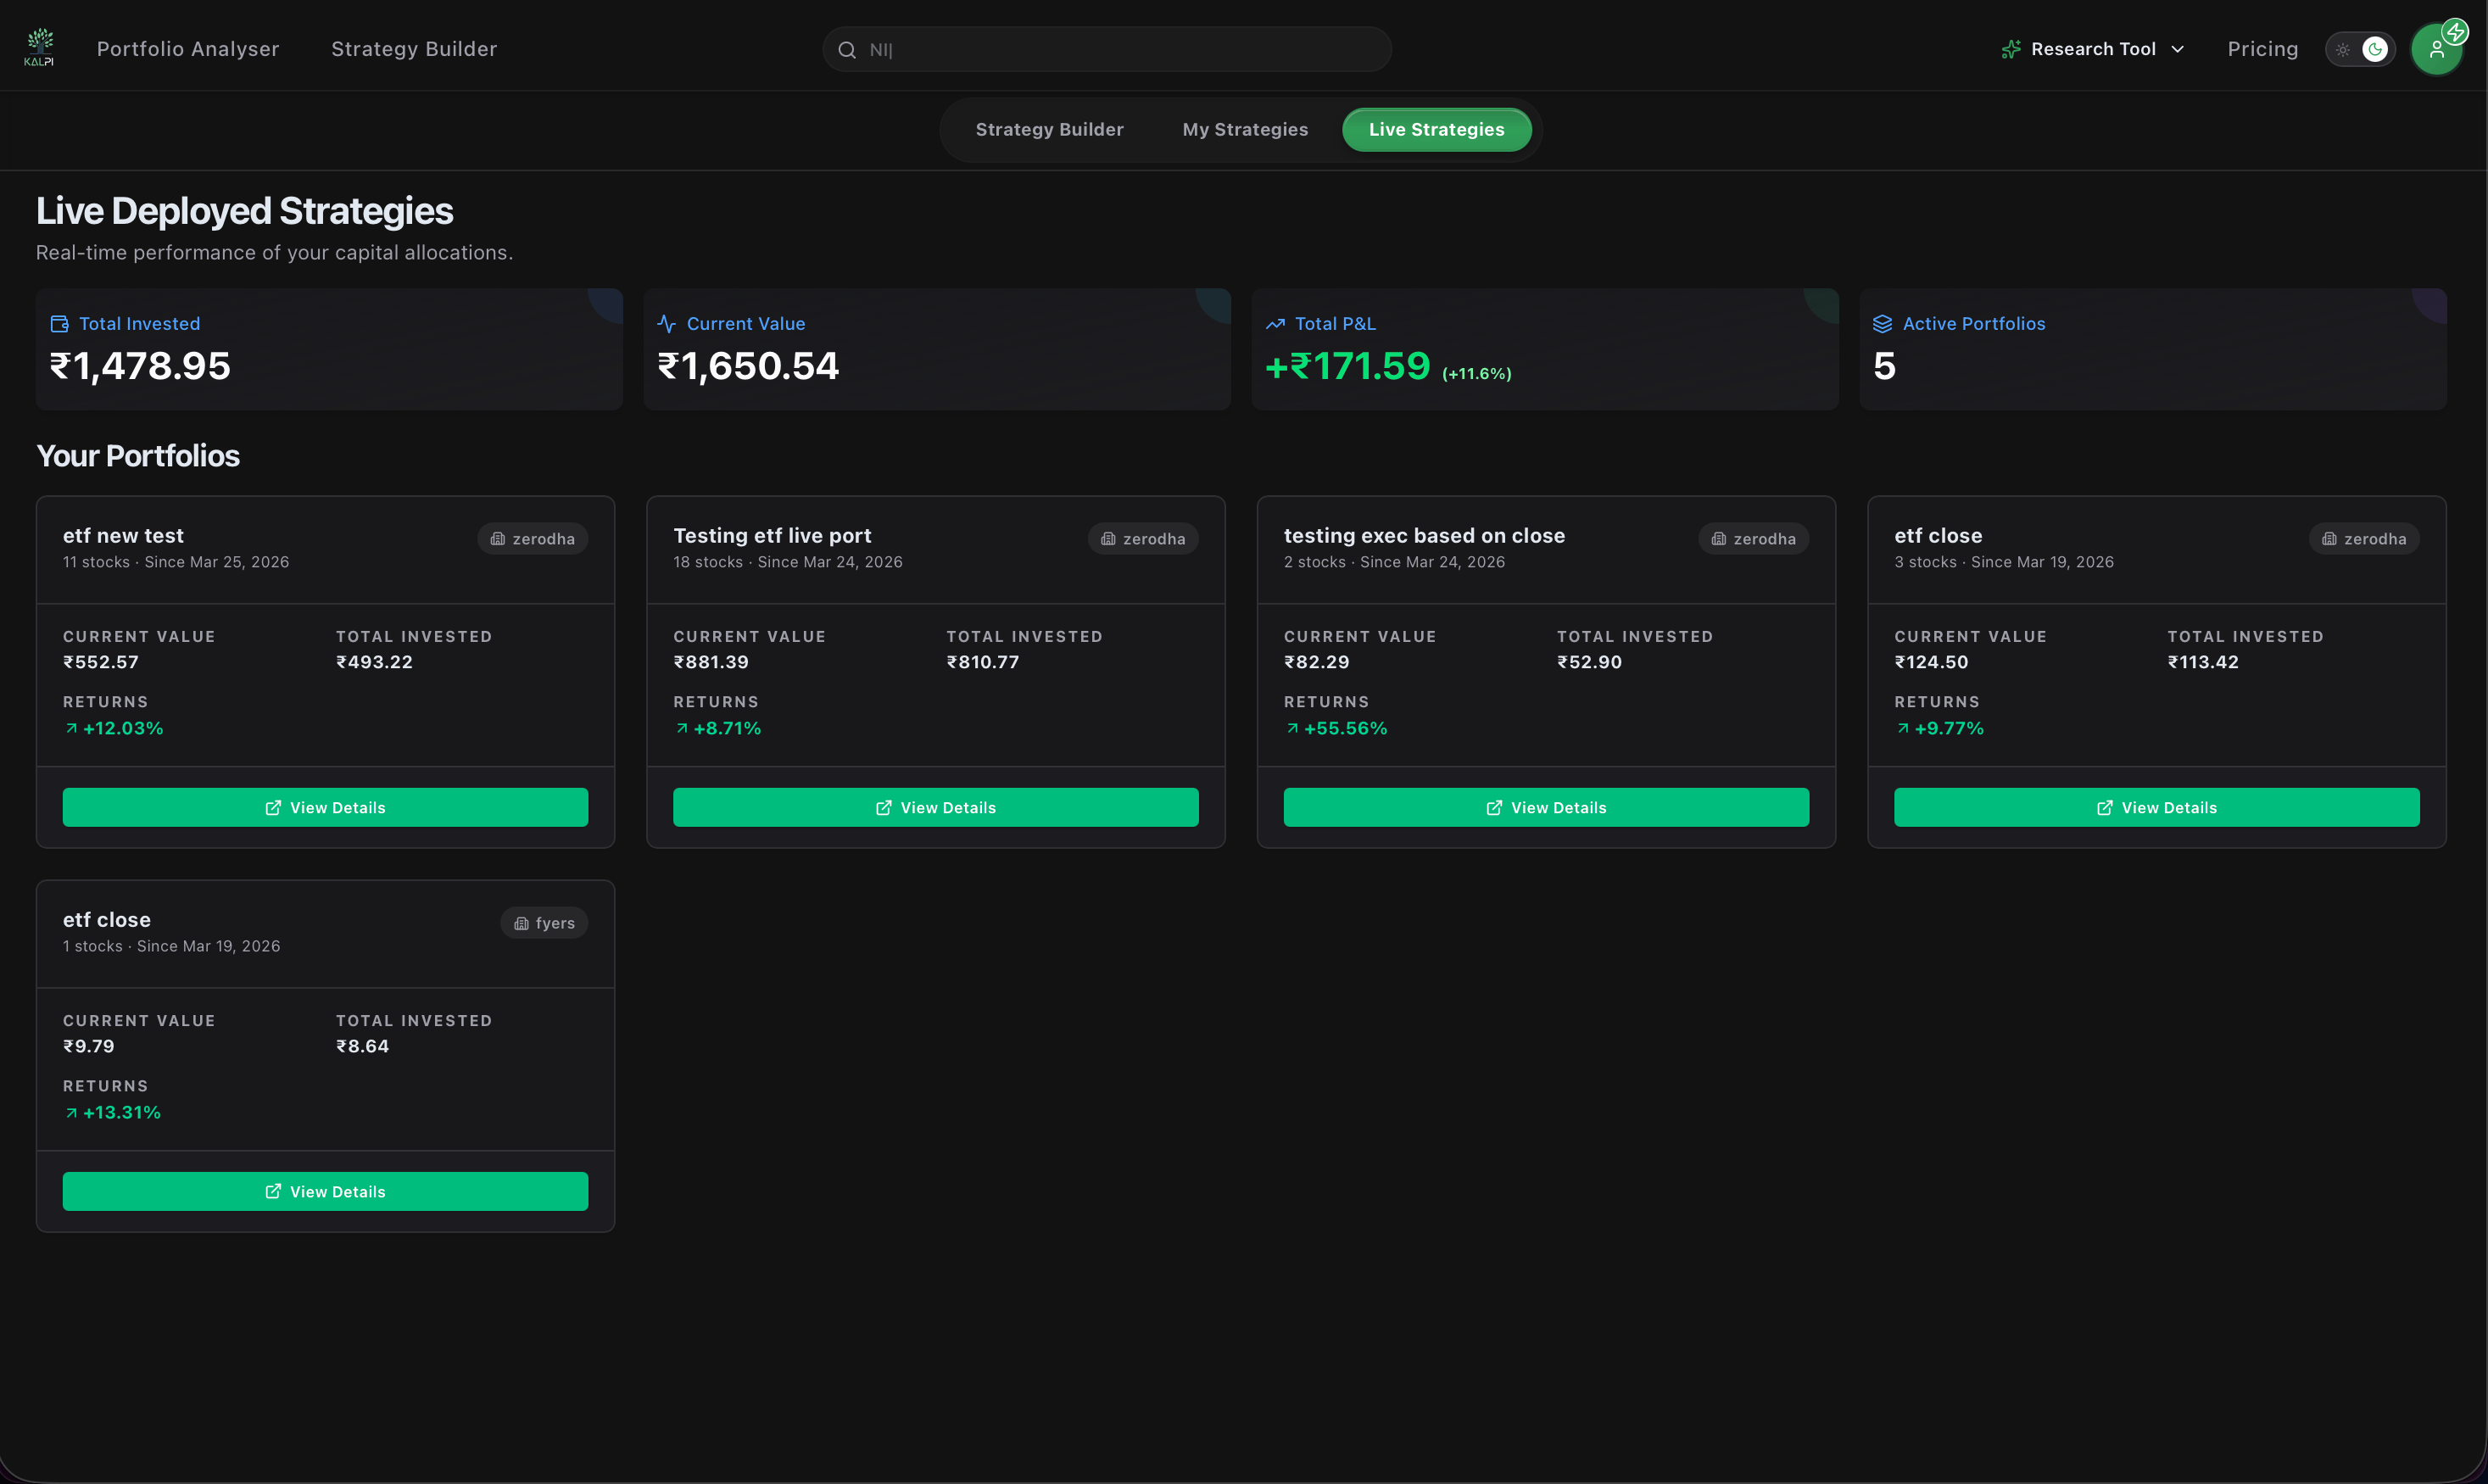
At the top of the page, you will see your aggregated account metrics across all active algorithmic trades, including your **Total Invested**, **Current Value**, and absolute **Total P\&L**.
Below the aggregate metrics, every active strategy gets its own dedicated card. Each card displays:
* The connected broker executing the trades (e.g., Zerodha, Fyers).
* The exact date the strategy was deployed.
* A high-level summary of the capital invested and the overall percentage returns.
## Portfolio Deep-Dive
To see exactly what is happening under the hood of an active strategy, click the green **View Details** button on any card.
Once inside the details view, you have access to professional-grade tracking tools:
The top panel provides a comprehensive overview of the strategy's health. Track your **Total Unrealized Returns** alongside advanced risk metrics like **XIRR (Annualized)**, **Volatility**, **Sharpe Ratio**, **Sortino Ratio**, and **Max Drawdown**.
The **Holdings** tab provides a real-time table of every instrument currently in the basket. You can view the exact Quantity, Average Price, Last Traded Price, and individual P\&L. Click any column header to instantly sort the data (e.g., sorting by highest returns). You can also toggle to the **Historic Order** tab to review past transactions.
Need to run your own analysis or keep external records? Click the **Export** button in the top right corner to instantly download your strategy's current holding data directly to your device as a spreadsheet.
**Broker Syncing:** The Live Strategies page acts as a mirror to your connected broker. Your P\&L, holdings, and executed orders are pulled directly from your broker account to give you a centralized, institutional-grade view of your algorithmic trades.
***
Ready to go deeper? Move to the next section to learn how to import and analyze your entire external portfolio.
Need to link another broker account to run more live strategies? Review the connection guide.
## The Dashboard Overview
At the top of the page, you will see your aggregated account metrics across all active algorithmic trades, including your **Total Invested**, **Current Value**, and absolute **Total P\&L**.
Below the aggregate metrics, every active strategy gets its own dedicated card. Each card displays:
* The connected broker executing the trades (e.g., Zerodha, Fyers).
* The exact date the strategy was deployed.
* A high-level summary of the capital invested and the overall percentage returns.
## Portfolio Deep-Dive
To see exactly what is happening under the hood of an active strategy, click the green **View Details** button on any card.
Once inside the details view, you have access to professional-grade tracking tools:
The top panel provides a comprehensive overview of the strategy's health. Track your **Total Unrealized Returns** alongside advanced risk metrics like **XIRR (Annualized)**, **Volatility**, **Sharpe Ratio**, **Sortino Ratio**, and **Max Drawdown**.
The **Holdings** tab provides a real-time table of every instrument currently in the basket. You can view the exact Quantity, Average Price, Last Traded Price, and individual P\&L. Click any column header to instantly sort the data (e.g., sorting by highest returns). You can also toggle to the **Historic Order** tab to review past transactions.
Need to run your own analysis or keep external records? Click the **Export** button in the top right corner to instantly download your strategy's current holding data directly to your device as a spreadsheet.
**Broker Syncing:** The Live Strategies page acts as a mirror to your connected broker. Your P\&L, holdings, and executed orders are pulled directly from your broker account to give you a centralized, institutional-grade view of your algorithmic trades.
***
Ready to go deeper? Move to the next section to learn how to import and analyze your entire external portfolio.
Need to link another broker account to run more live strategies? Review the connection guide.